
Our Thoughts on the Fed Rate Decision and Market Impacts
Hello, Friends:
This week has the potential to be an interesting one for the markets. On Wednesday, July 31st, the Federal Reserve is widely expected to reduce the Fed Funds Rate[i] by 0.25%. On the surface, this may not seem like that big of a deal, but the decision by the Fed could set the stage for heightened market volatility over the near to intermediate term, either for stock markets, bond markets, or both—not only for the near term, but potentially well into 2020.
Now that I have your attention, let’s set the stage a bit. Back in August 2018 during the Federal Reserve’s annual conference in Jackson Hole, the current Fed Chairman Jerome Powell suggested that the Fed planned to continue slowly raising the Fed Funds Rate, and in essence continue working to close the stimulative floodgates that were opened during the financial crisis 10 years prior and in the years immediately following. The chart below shows the effective Fed Funds Rate dating back to 2008. We can see the pre-crisis and post-crisis rates.
Chart 1: Effective Fed Funds Rate Since 2007
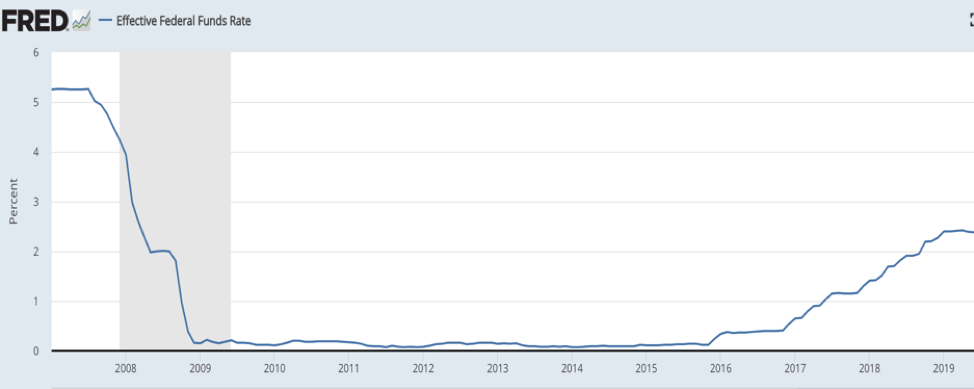
Source: Federal Reserve of St. Louis
The Fed’s focus at the time of the August 2018 meeting was consistent with prior communications—namely that it was most intent on making sure inflation didn’t get out of control, as economic growth seemed to be on solid ground. It also wanted to make sure it was on track to be in a neutral position so that it had dry powder on hand for the next potential downturn.
Just a few months after that August 2018 Fed meeting in Jackson Hole, stock markets were in freefall, with many of the major indexes declining by 20% or more before bottoming out just before the Christmas holiday. The August meeting, and a subsequent (and well telegraphed) rate hike by the Fed in both September and then December, had investors in a temper tantrum, believing the Fed was out of touch with economic reality, that the economy wasn’t as strong as believed, that inflation concerns were overblown, and that the Fed was causing unnecessary pain to the economy. Evidence later in this communication will show that maybe investors had a point. It wasn’t until Chairman Powell clarified the Fed’s view, indicating that it was indeed willing to be “flexible” with rate decisions, that markets breathed a little and started to recover from the declines.
2019 Markets: Stocks Go Up, Rates Go Down
Chart 2: S&P500 vs. 10-Year Treasury Rates Since January 2018

Since the Fed “clarification” in late December 2018, the S&P500 has increased by over 25%—granted, the first 20% of the rise simply got the S&P back to where it was in late September. At the same time, bond rates (in green above) have continued to trend lower from a peak of over 3.20% in November to just over 2% today. After all, in 2018, much of the narrative was specifically about rising inflation. Markets were in a race to predict how high inflation and thus rates might go. Now, we’re discussing the opposite.
If the stock market is a gauge of growth prospects for corporations, and the bond market is a gauge of economic and inflation prospects, does the above chart put the two at odds with one another? It seems the stock market has put a lot of faith in the Fed reopening the spigots a tad, while the bond market either believes the economy is faltering or that inflation is nonexistent, which then supports the case made by stock market investors. Yet it seems someone is bound to be disappointed going forward, but whether it is stock investors, bond investors, or both is what will likely play out for the remainder of 2019 and perhaps well into 2020.
The Data
One of the arguments made by those advocating lower rates has been that the economy is weakening and therefore is in need of some love. In looking at quarterly GDP[ii] in the chart below, there has been some evidence of weaker growth. However, in looking at the same data through a wider lens, we can see that economic growth has been in a fairly steady range dating back to just after the financial crisis.
Chart 3: GDP Growth

Unemployment has been on a downward trend since 2009 and is now at levels not seen since the late ’60s. Is this a time to be cutting rates? That’s a tough one to answer, but if history is any guide, it’s probably not the best time to be super bullish on stocks either. Is this data why the stock market is clamoring for rate cuts now? Is the golden goose going gray?
Chart 4: Unemployment Rate

Is Lower Inflation Driving the Rate Narrative? I Think So
The Federal Reserve has a dual mandate, that being to help maximize employment (steady economy) and to maintain price stability (aka keep inflation in check). It’s no easy task. The Fed has been quite transparent in suggesting that it has a rolling target on inflation of 2%, but because inflation stayed stubbornly low following the financial crisis, the Fed kept its foot on the stimulus gas for longer than normal (see the Fed Funds Rate chart earlier) to try to get inflation to trend at or even above target just to right-size the averages over time.
Chart 5: Core Inflation

I believe the discussion around the Fed Funds Rate has had less to do with economic concerns than with the lack of any measurable increase in inflation, if not a decrease in inflation of late. With unemployment at 50-year lows and inflation in check, it seems that markets would have preferred that the Fed had taken a wait-and-see approach with respect to rate hikes both in September and December 2018. I would argue that had the Fed done just that, we might right now be staring at an inflationary spike, which can be difficult to bring under control once it takes hold.
Looking Ahead at Financial Markets
While it will be tough to handicap where we go from here, I will go with the herd and suggest that the Fed will cut rates on Wednesday, and then hint that a September cut is also on the table. One might be inclined to believe that this would provide a huge boost to the stock market, but I’m not so sure. Simply looking at Chart 2 would suggest that these expectations have already been baked in. Another reason is that stock valuations are already the third-most expensive in history. There is still room for upside, but one has to have a strong stomach and be comfortable with heights and the risks of staying too bullish in the current climate.
The bond market is arguably even more tricky than the stock market to figure out over the nearer term. We’ve seen a dramatic shift in the direction of interest rates since November 2018, with investors gobbling up debt, pushing prices higher and thus driving rates lower. If a rate cut on Wednesday starts a new, upward trend in inflation, bond prices could see some downward pressure, particularly longer-term bonds, while inflation-linked bonds could become attractive again. If the rate cuts don’t equate to higher inflation, then I believe the direction is lower for bonds, and likely the sign that the next recession is nipping at our heels. I tend to watch the bond markets as a more telling gauge of future expectations, and until rates shift higher, I prefer to be careful.
In mid-June, we rebalanced client portfolios to take a more cautious stance. We reduced stock exposure and upped our bond and cash exposure. For some time now, we have opted for lower volatility equity strategies over the more buzzworthy and growthy names one reads about daily. Thus, we’ve perhaps missed out slightly on potential upside, but we can live with that until we see better evidence that the stock market deserves to move higher.
Until next time. Thank you for reading,
Brian Aberle, CFP
President - Aberle Investment Management.
[i] The Fed Funds Rate is the interest rate at which financial institutions lend reserve balances to other depository institutions overnight. The Fed Funds Rate helps shape the interest rates that consumers and companies pay on adjustable rate debt, and often determines the interest earned on cash deposits.
[ii] GDP (Gross Domestic Product) is the value of goods and services produced in a given year.