
Smart Money vs. Dumb Money? A Quick Look at a Unique Sentiment Indicator
By Brian Aberle
One area that has grown quite a bit in my research as an advisor, especially over the past decade following the financial crisis and the recession, has been the study of market sentiment. Maybe it's me still seeking internal amends for the markets from over a decade ago, trying to look under every rock to make sure I'm not smacked in the face by the obvious "of course it didn't make sense that no money down, and lousy credit could get someone a McMansion in 2006". Or, perhaps it's just the more logical view that sentiment studies can help us understand how others are feeling, whether they are CEOs, economists, big investors, or the everyday Joe. Whatever the rationale, understanding investor sentiment might help us all as investors to make better decisions, both from a strategic sense and tactical sense.
Smart Money/Dumb Money Indicator
In this post, I wanted to share my thoughts on one sentiment indicator that I have come to watch with regularity, and why I think it matters today.
Though I'm not a big fan of the name, the Smart Money/Dumb Money Spread courtesy of the good folks at SentimentTrader, which we subscribe to, is an indicator that seeks to study the actions of two different types of investors and how these actions potentially correlate to market returns. First, they measure the sentiment of the so-called "smart money" by observing institutional sized transactions. They then measure the view of the so-called "dumb money" as determined by smaller, typically more retail investor transactions. They then compare the difference or spread of one versus another. The underlying logic of the study would suggest that we follow the "smart money," especially when it reaches the extremes. When the spread is positive, it means large investors believe stocks are heading higher over the nearer term. When it is negative, it means large investors believe stocks are heading lower. Conversely, the "dumb money" tends to be more trend-chasing. It is often poor at marketing timing, though reasonably accurate during the meat of the trend, which we seem to be in early 2020.
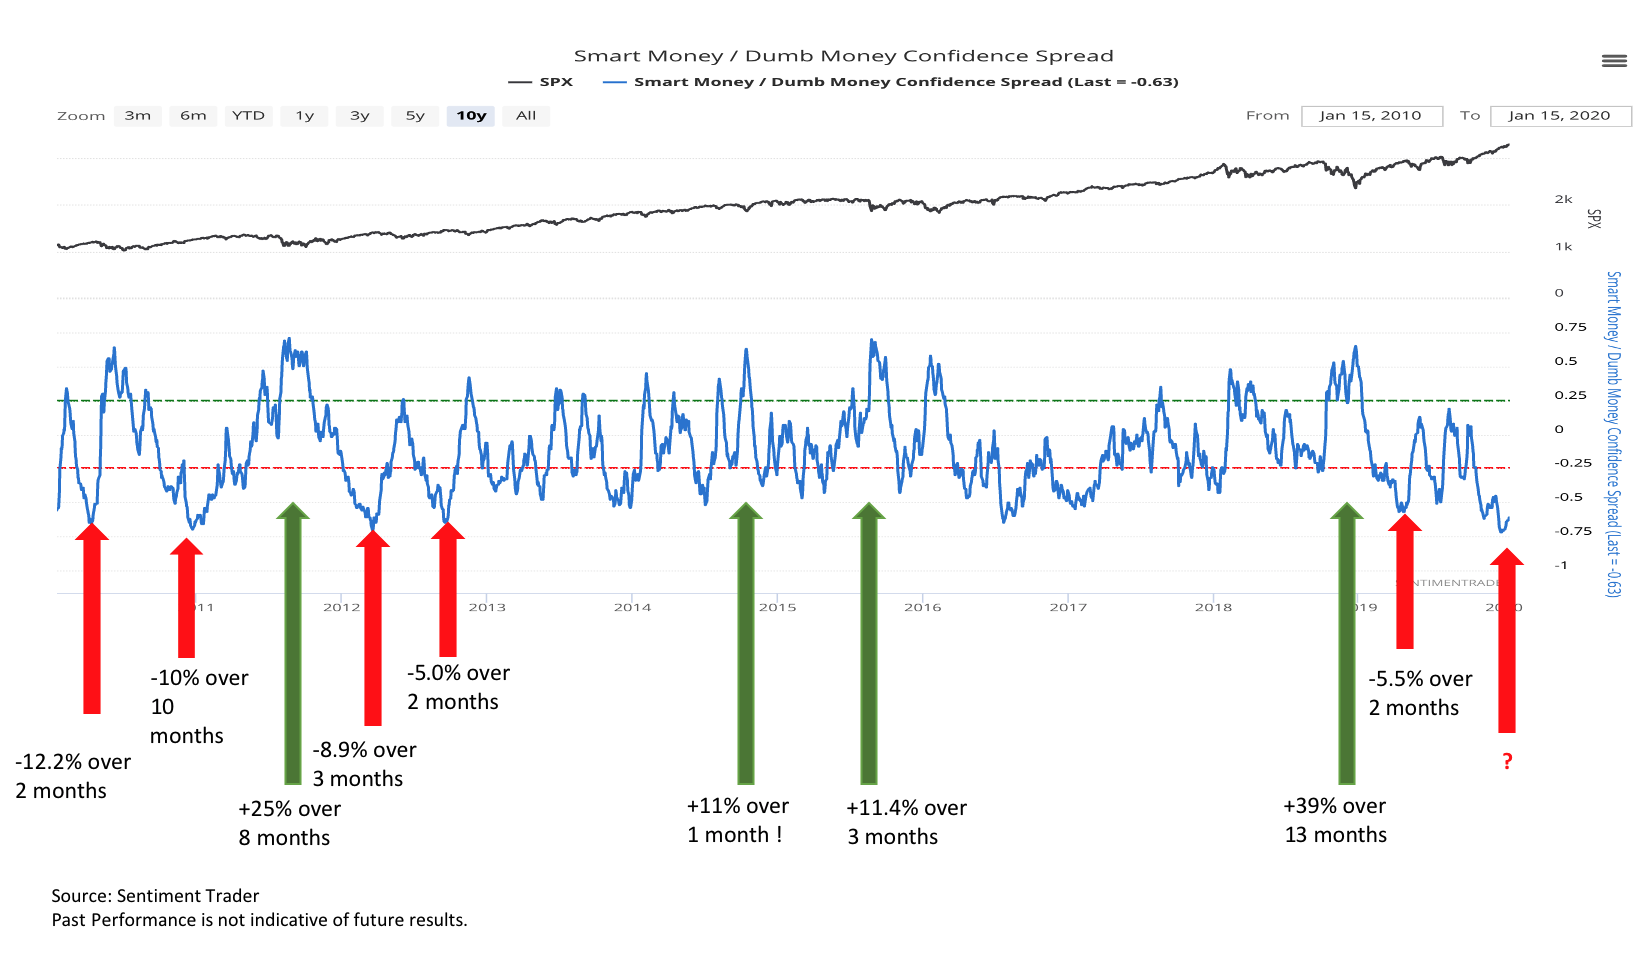
In the above chart, I have highlighted corresponding returns for the S&P500 from when the indicator went from one extreme to the opposite extreme. The red arrows highlight periods when spreads were decidedly negative (bearish), while the green arrows indicate when spreads were decidedly positive (bullish). Sometimes, these periods were a few short months. Other times, they stretched out over a year. What I believe you can see is that at least at the extremes, the indicator tends to work pretty well. Green tended to be a positive sign, while red suggested caution.
In late 2019, the signal dropped to the lowest level since 2004, which is not in the chart. What happened in 2004? Well, first, 2003 was a solid year for the markets, with returns over 28%. For comparison, in 2019, the S&P500 was up over 31%. 2004 started strong and then faltered heading into the presidential election, before rally post-election for a positive finish. Could this happen in 2020? We will have to wait and see.
Below is a different view of the indicator; however, this time, the "dumb" sentiment and "smart" sentiment are separated, which helps us to visualize the disparity better. It’s a little easier to see how extreme the two indicators are today, though ironically, the gap has narrowed just a tad.

There are some caveats to sentiment readings like the one I've shared today. That being, indicators like this aren't always great for market timing, and they can be quite lousy for long term investors. As the second chart also points out, sentiment can be quite volatile. Thus, from a timing standpoint, it's akin to knowing there is a higher probability for rain, but not knowing the precise moment to pop open the umbrella. Trying to time the markets too much can lead to potentially missing out on strong near term trends like some have experienced from October 2019 to this writing in January of 2020.
Sentiment also tends to be validated or invalidated after the fact, meaning only when markets ultimately go up or down can we see see if the indicator actually worked. Finally, little is said about the periods when sentiment is not extreme, which we can frankly say is most of the time. In the charts above, the S&P500 increased by over 280% from January 2010 to January 2020. One just had to tune out the extremes. Easier said than done, I know. If you at all watch the financial TV networks, it’s easy to be convinced that there is a dumpster fire every 5 seconds. It’s tough to have a 10 year perspective.
How We Incorporate Sentiment Readings
At Aberle Investment Management, we have sought to balance the longer-term, more strategic view of the markets, with that of the shorter-term more tactical and dare I say emotional aspects within the markets. The solution we came up with was to create two different "buckets" within investment strategies.
Strategic Bucket
First, we have the strategic bucket, which tends to focus on economic and fundamental themes that we believe might play out over a time frame of 6 months to a year. We normally earmark 50-60% of our portfolios to this bucket. We prefer to leave this bucket alone as much as possible to allow said themes to play out over the time frame we've identified. This is our buy and hold (for a while) bucket and would be akin to staying in our lane on the highway and looking further down the horizon. Or, in looking at the above charts, trying to ignore the short term swings.
Tactical Bucket
The second bucket is our tactical bucket, which is, as the name implies, where we make more tactical shifts in client portfolios based on readings like the one I have included in this post as well as other tools. These adjustments can happen more frequently. Sticking with the driving analogy, this would be akin to changing lanes when needed, but still moving forward down the road.
Rebalancing the Buckets
Every six months or so, we carry out a total rebalance of our client portfolios, based both on changes to economic themes, but also to bring our ratios and portfolio allocations back into alignment.
We think this strategy works because we can scratch a tactical itch according to indicators like the green and red arrows in the above chart. At the same time, we are also helping our clients to stay invested over the longer term, which is where the real compounding and wealth creation tends to happen if history is any guide.
Conclusion
The moral to the story is this; sentiment can be an essential gauge for how the markets might do over the nearer-term and, thus, tactically can be advantageous for investors, especially when times seem a bit extreme. Yet, it is not a replacement for a buy and hold strategy that many want to have but just can't stomach 100% of the time due to volatility and the noise within the news that so often ensues. Within our practice, we use indicators to help us try to see beyond the noise of micro trends. After all, if economists are uneasy about things, best we view their overall sentiment rather than waste our time studying the same economic data that they seem to relish in doing. We think creating different portfolio buckets may be an optimal solution for investors to balance the long term with the short term.
We can Help
If you believe you could benefit from a fresh look at your portfolio, please reach out to us. If you have over $200,000 in investable assets, we are happy to offer a no-obligation review of your portfolio and even stress test it to potential market events. If you think you would benefit from a fresh set of eyes monitoring your portfolio, we would love to help.
As always, thank you for reading.
Brian Aberle,
Aberle Investment Management LLC, is a registered investment adviser. Information presented is for educational purposes only and does not intend to make an offer or solicitation for the sale or purchase of any specific securities, investments, or investment strategies. Investments involve risk and, unless otherwise stated, are not guaranteed. Be sure to first consult with a qualified financial adviser and/or tax professional before implementing any strategy discussed herein. Past performance is not indicative of future returns.